
2e - Geolocation and use of a map to select recipients
Geolocation and use of a map to select recipients
The map is located in the same section as the Recipients.

The map shows a red dot that identifies your position (determined according to your workplace address).
It is possible to display the map of the territory that includes the residents to whom you need to send notifications or alerts. You can also zoom in and out of the map by clicking on the + and - buttons at the bottom of the map.

You can also draw a geometric shape on this map, taking into account neighbourhoods, streets, riverbanks, parks, etc. It is possible to display the map in satellite mode to better distinguish buildings, for instance. A palette of drawing tools is available in the upper right corner of the map to help you draw geometric shapes. You can choose to draw rectangles, circles or polygons. (When drawing polygons, click where you want to start to draw and then click each time you need to break the line until you have a closed shape).
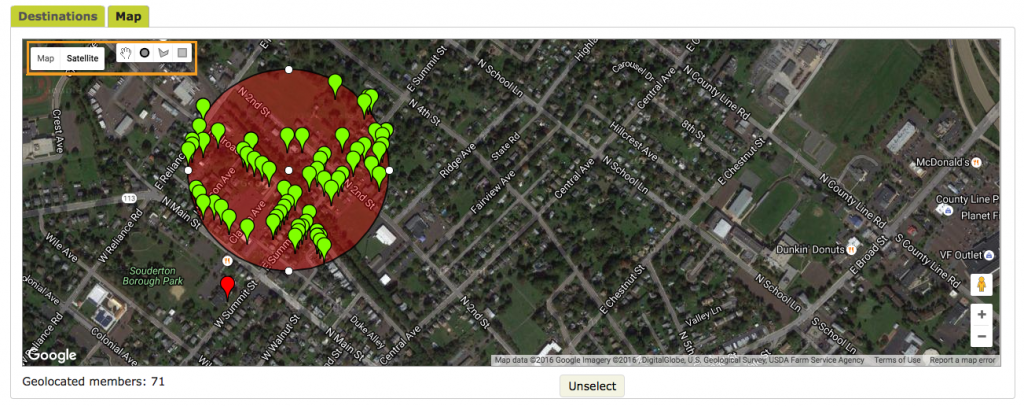
The drawn geometric shape becomes a selection of recipients and you can send a message to them as if they were in a group. The recipients are highlighted in green. When such a selection is made, it is even possible to return to the Recipients grid to find out exactly who these selected contacts are.
You can also move around the map using the arrows on your keyboard. This allows you to cover larger areas by drawing with a tool.

A button at the bottom of the map allows you to display the map in "Fullscreen".

You can also choose a security perimeter by selecting the radius of your choice (in metres or kilometres), depending on your needs.
You can use geometric shapes that have been saved beforehand; these are called geogroups.
Geogroups
Situations may arise where you need to create contact groups that take geography into account. For example, a group of citizens in the southern neighbourhood. In such cases, the position of the contacts (latitude and longitude) determines whether they are part of a group or not. This is called a geogroup.
In the previous section, we discussed the use of the map. We know that you can draw shapes on the map so that some contacts may become selected and you can then send them a message. You can also create geogroups and then draw and save the shapes on the map. A tab called Geogroups contains the drawn and saved territories, which you can then display on the map.

For example, you can draw the different neighbourhoods of a municipality and save them one by one under any name you want. Citizens who will register later on will automatically appear in these geogroups as their location will be automatically added to their file. Note that these groups are kept up to date without any action required on your part.
To create a geogroup, let's first display the contents of the Geogroups tab. Click on the Create button at the bottom of the page to create, name and save the geogroup you are about to draw.

The map then appears on the right, along with the Modify button (as long as a geogroup is selected in the tab on the left of the map).
Simply draw the required shape to define the geogroup and save it.

Using the Shift key, you may draw many geometrical shapes at the same time.